Key reports at
your fingertips
With Projectal, you can drill into your current and past projects to access any data that you need and generate dynamic reports.
This visibility lets you analyze and report on project performance and business performance.

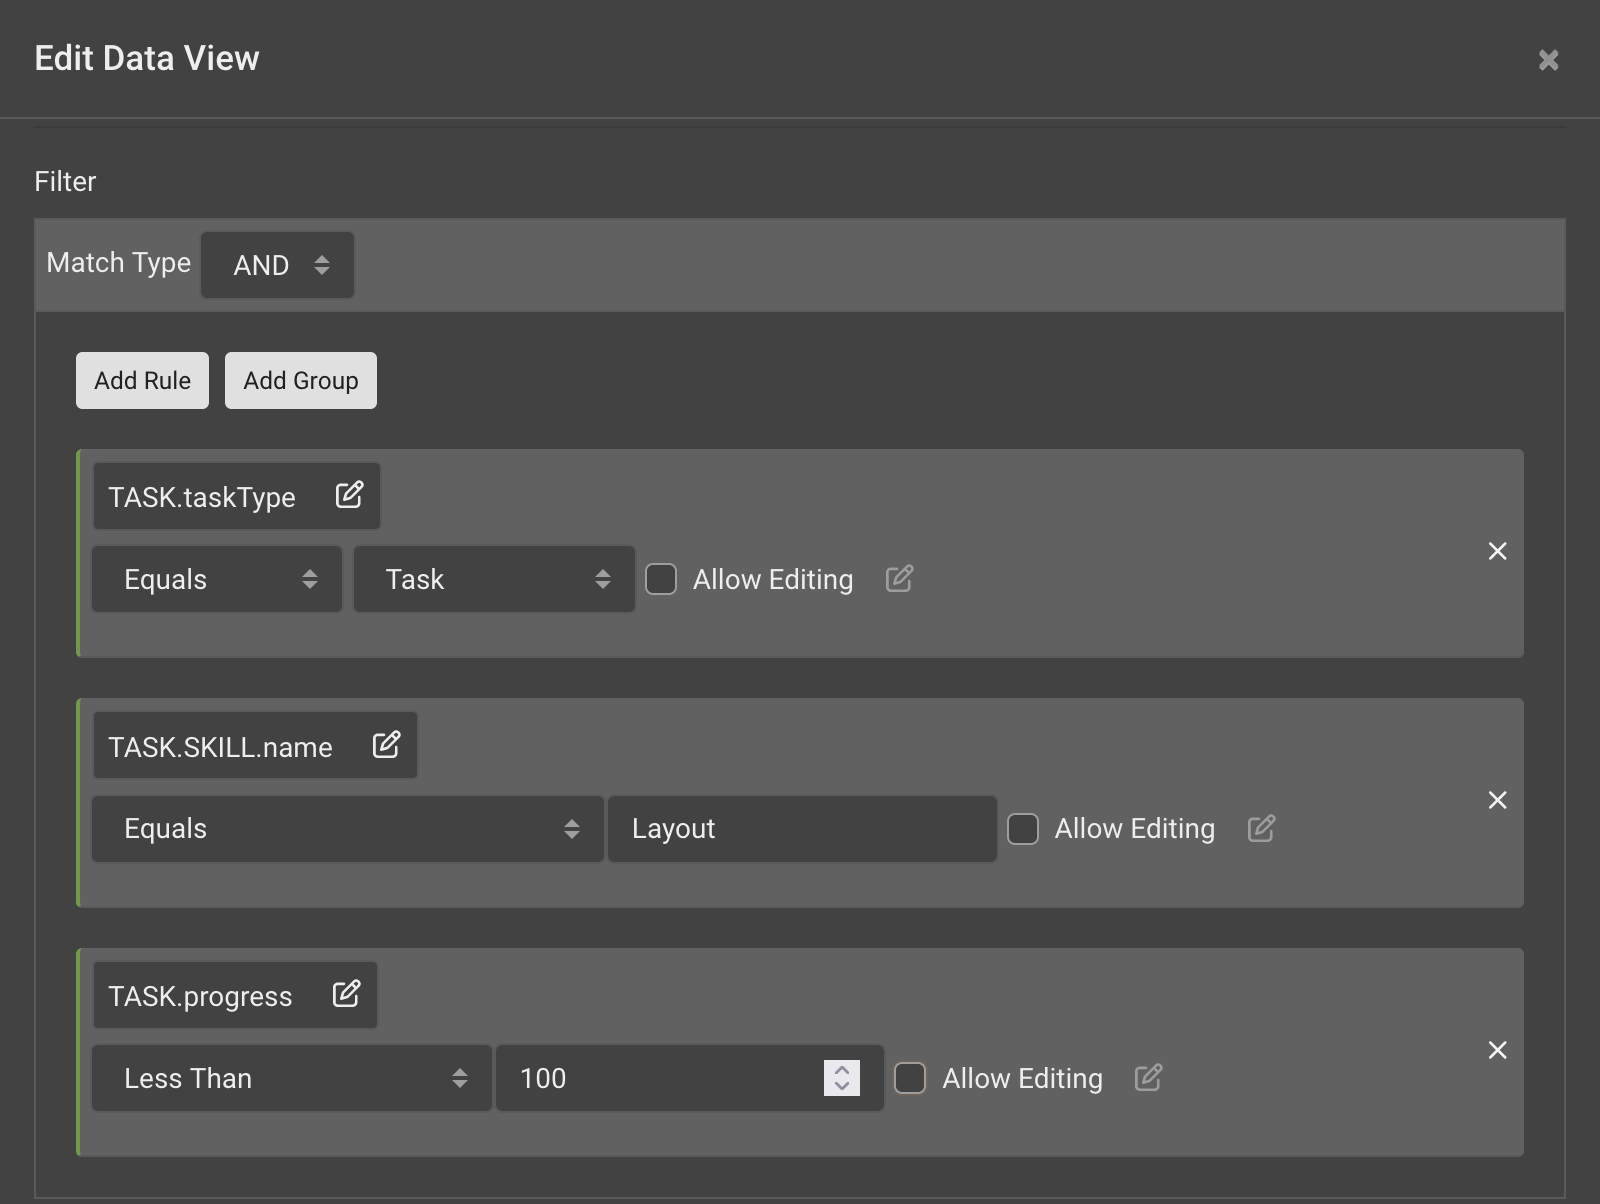
Data mining with custom data views
There are endless possibilities for you to data mine your projects. A visual query builder makes creating dynamic reports easy. For example, you can create data views that list:
Data views are fully interactive and can be exported from Projectal for use in other software tools.
Share data view reports with your team
Create public, private, or restricted reports
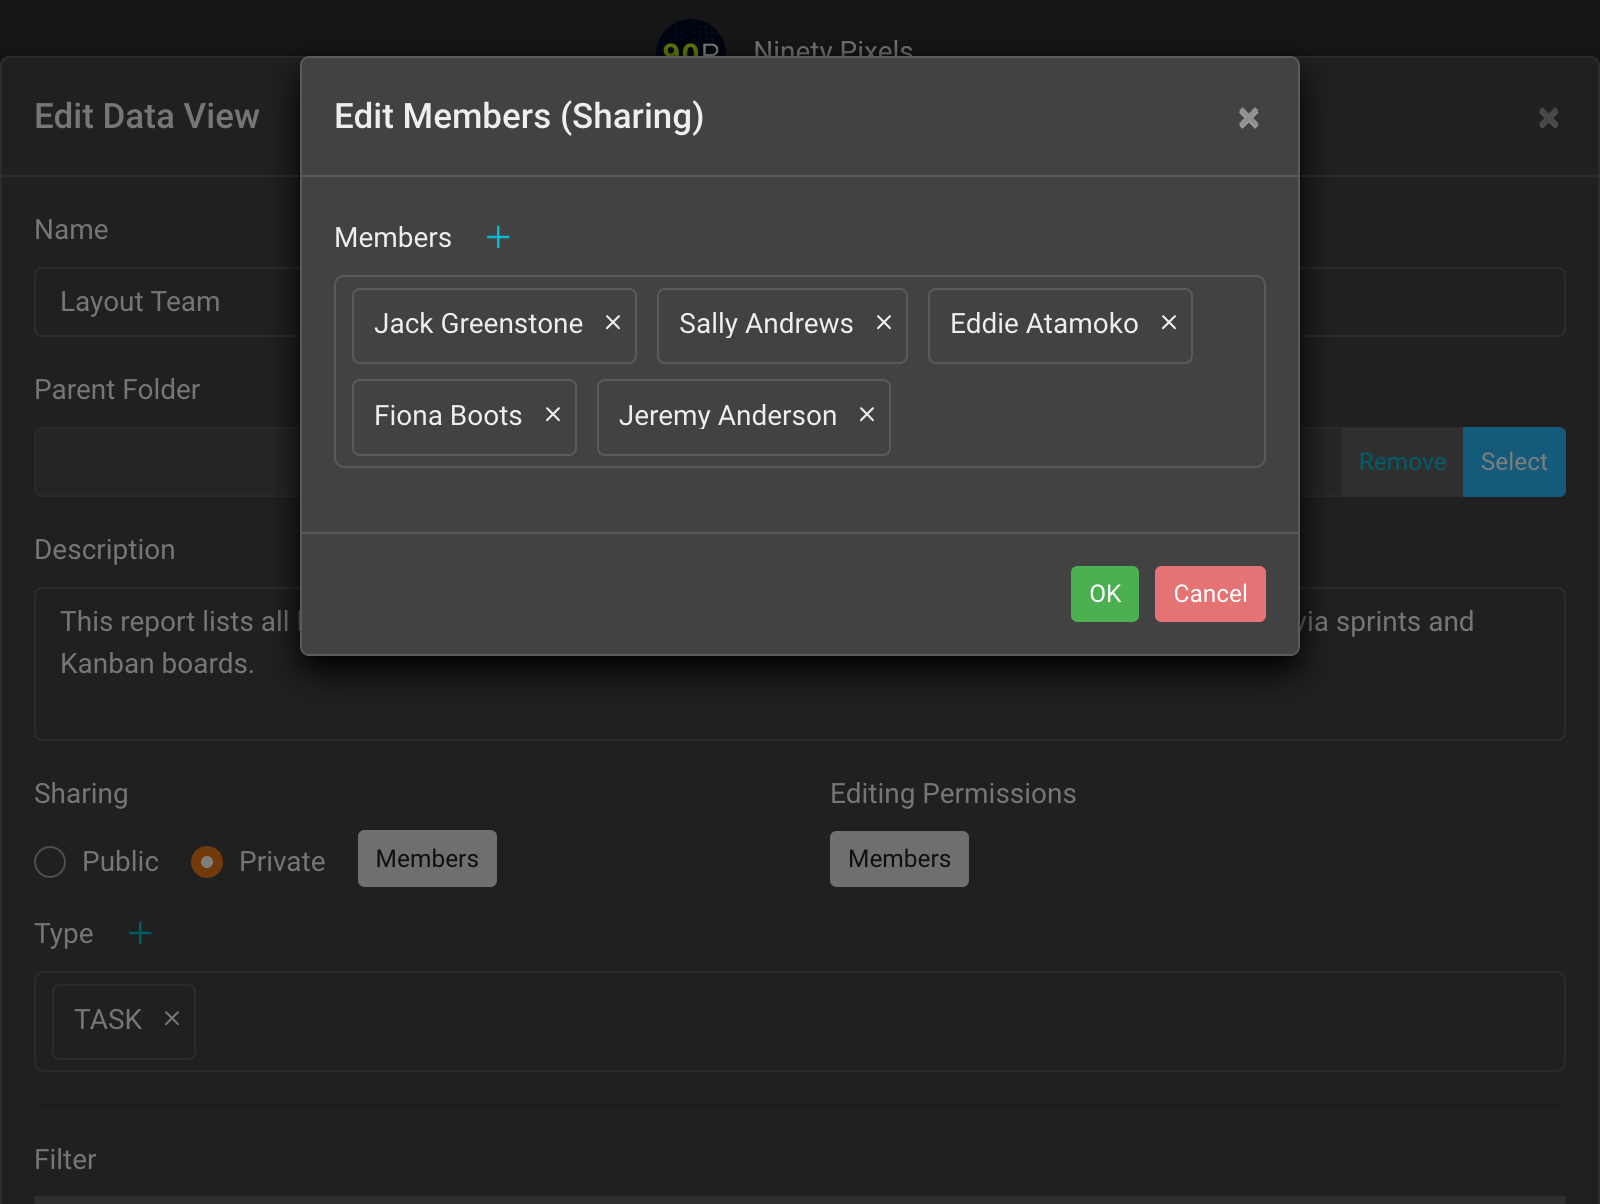
You can create public data view reports for all your staff. For example, a list of all the active tasks being worked on across all projects. Or, you can keep data views private to yourself. For example, a list of the key financials within certain projects. Or, you can share data view reports with specific staff. For example, as a team lead, you share a data view with your team so that they have visibility on current and upcoming tasks.
Integrate with other tools
Access data using the Projectal REST API and Python client library
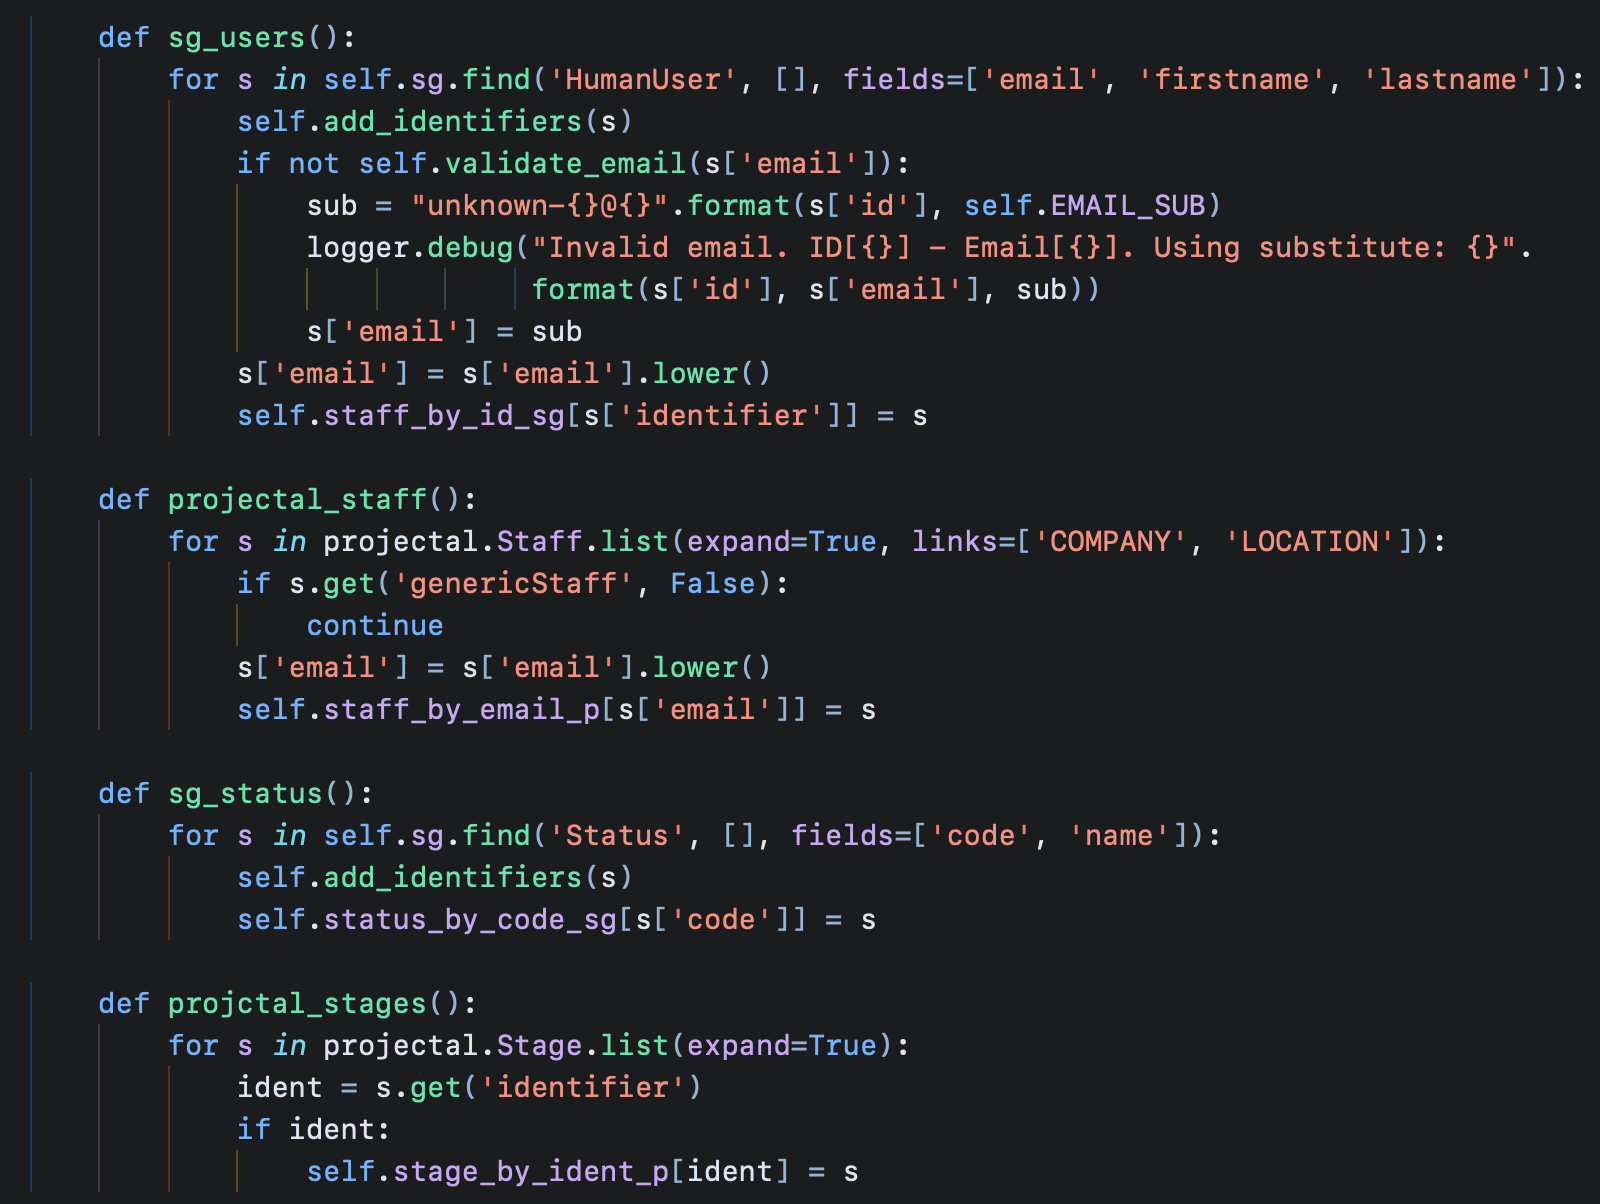
Using the Projectal API and Python client library, you can extract any data from Projectal and share it with other tools in your workflow.
The Projectal REST API and Python client library let you access any data stored in Projectal including tasks, milestones, projects, customers, staff, resources, actual costs, estimated costs, work effort, and much more.
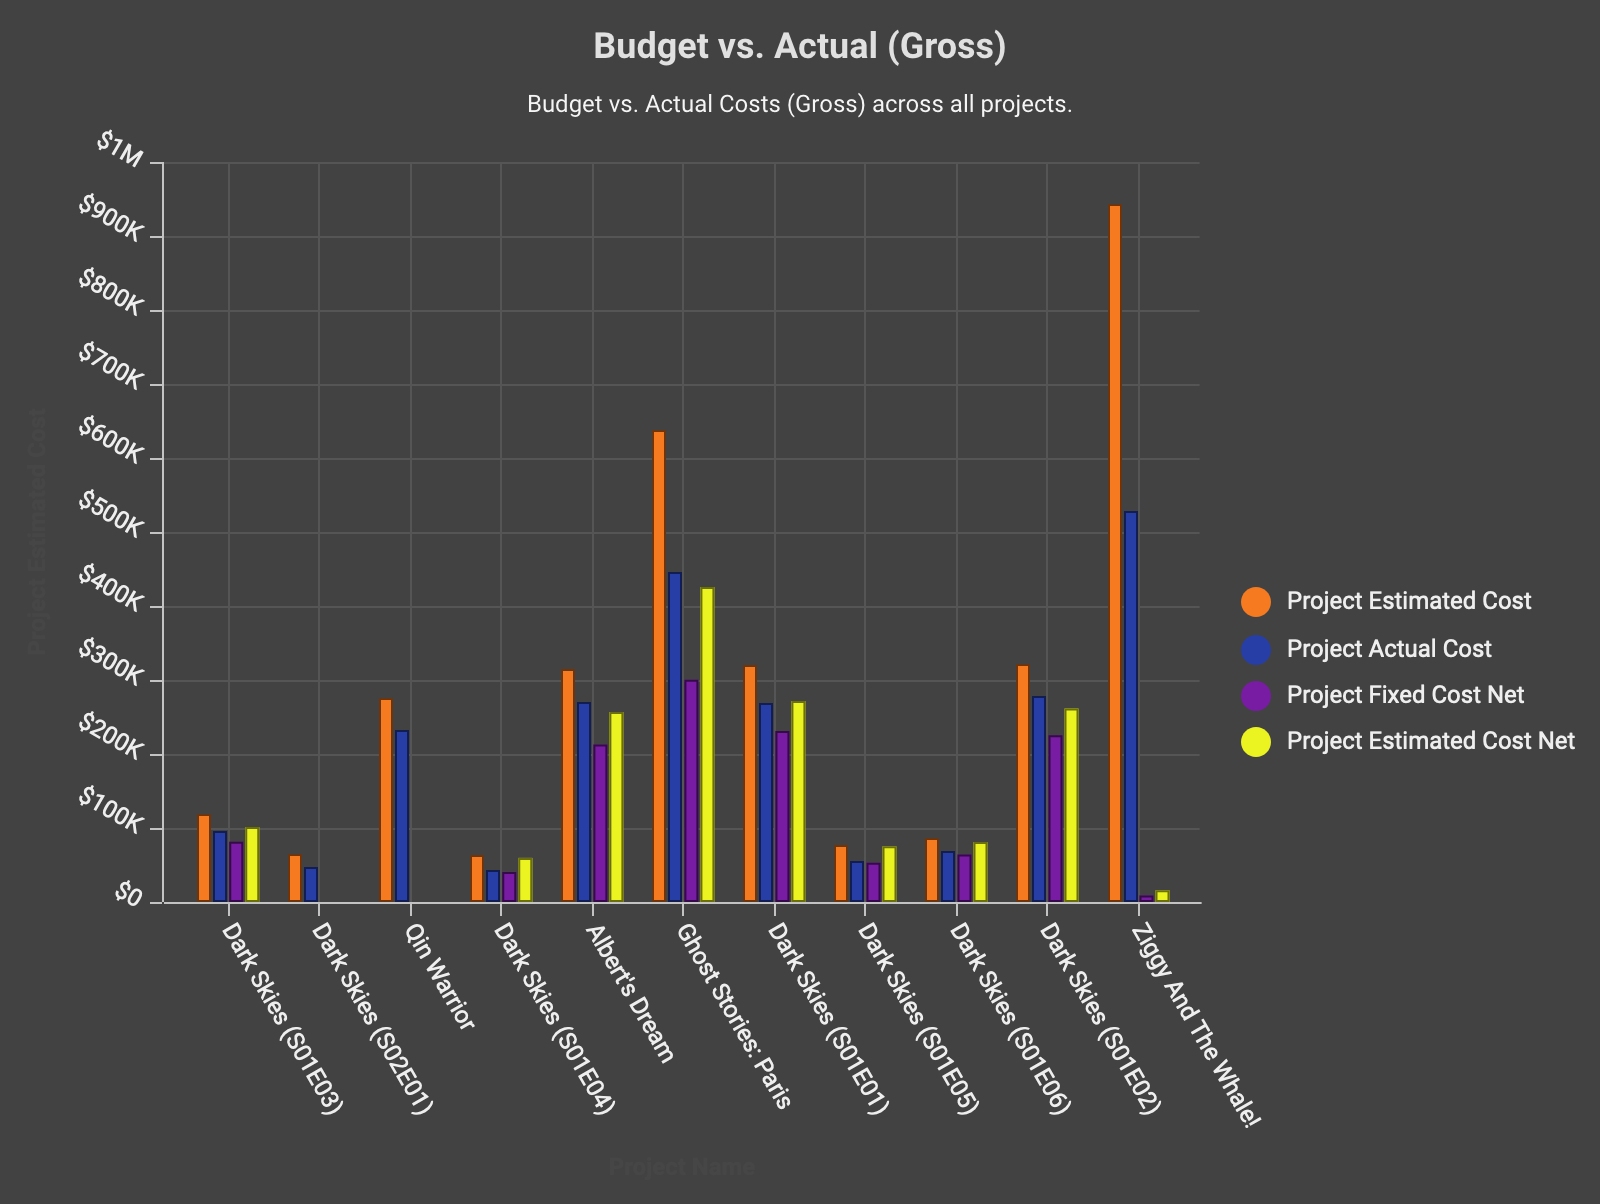
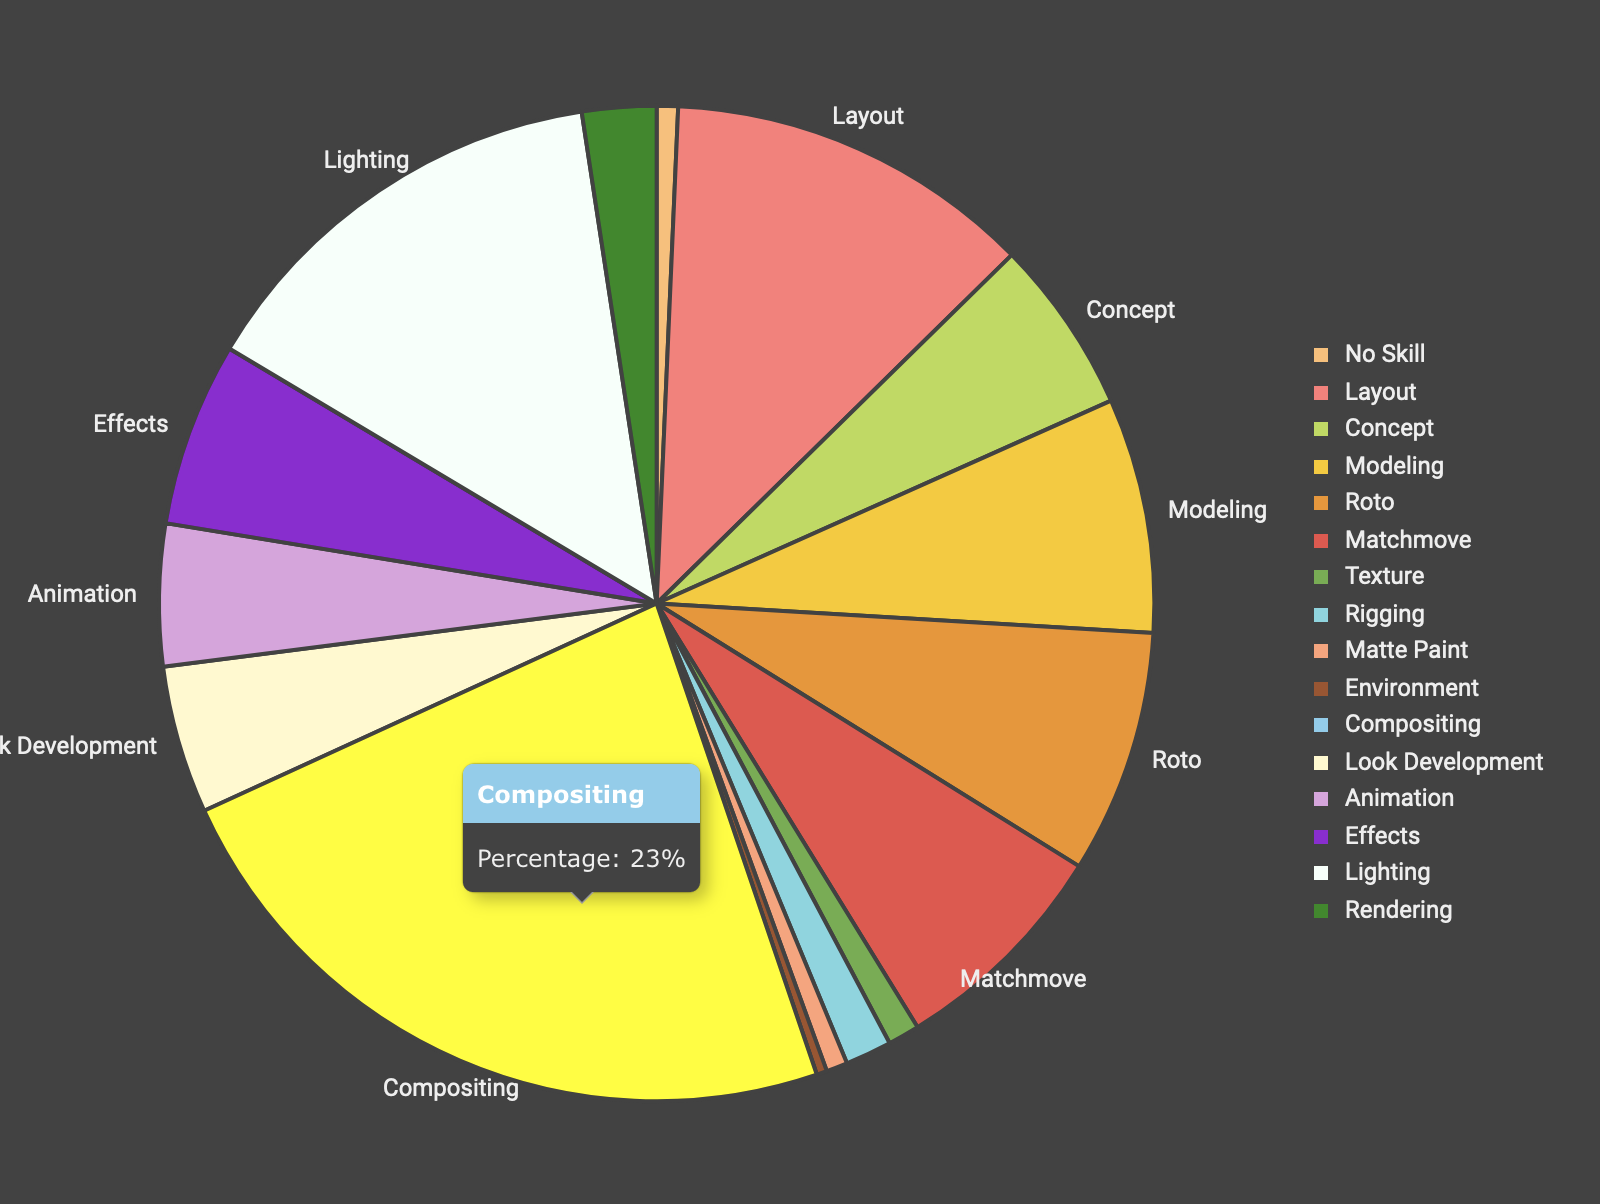
Get creative with charts!
After creating data views that list all the data you need to know, you can go a step further in Projectal and create great looking charts from that data. Charts are fully integrated into data views. Charts can be added to dashboards. Projectal includes extensive charting support including: