Using Formulas in Projectal to build Smarter Data View Reports

Reporting in a creative business often requires more than the standard set of fields stored in Projectal. Producers may need to see budget variance, studio heads may want a RAG status indicator, and resource managers may want to see availability metrics without having to calculate them separately.
The formula engine introduced in Version 7.0 lets you create these calculated values directly in Projectal to get real time insights and analytics about your creative business. It provides more than 80 functions, operators and conditionals that can be used in Data Views to combine fields, perform calculations, and return formatted results.
If you are familiar with formulas in Excel or Google Sheets, then you will easily pick up using formulas in Projectal.
Where formulas fit in a Data View Report
Every Data View column is one of three types:
Formula columns are useful when the value you want to display does not exist as a standard field in Projectal. To add a formula, open your Data View, click the + button in the Display section, and select the Formula tab on the Edit Field screen. The formula editor includes syntax highlighting, validation, formatting and inline examples as you write.
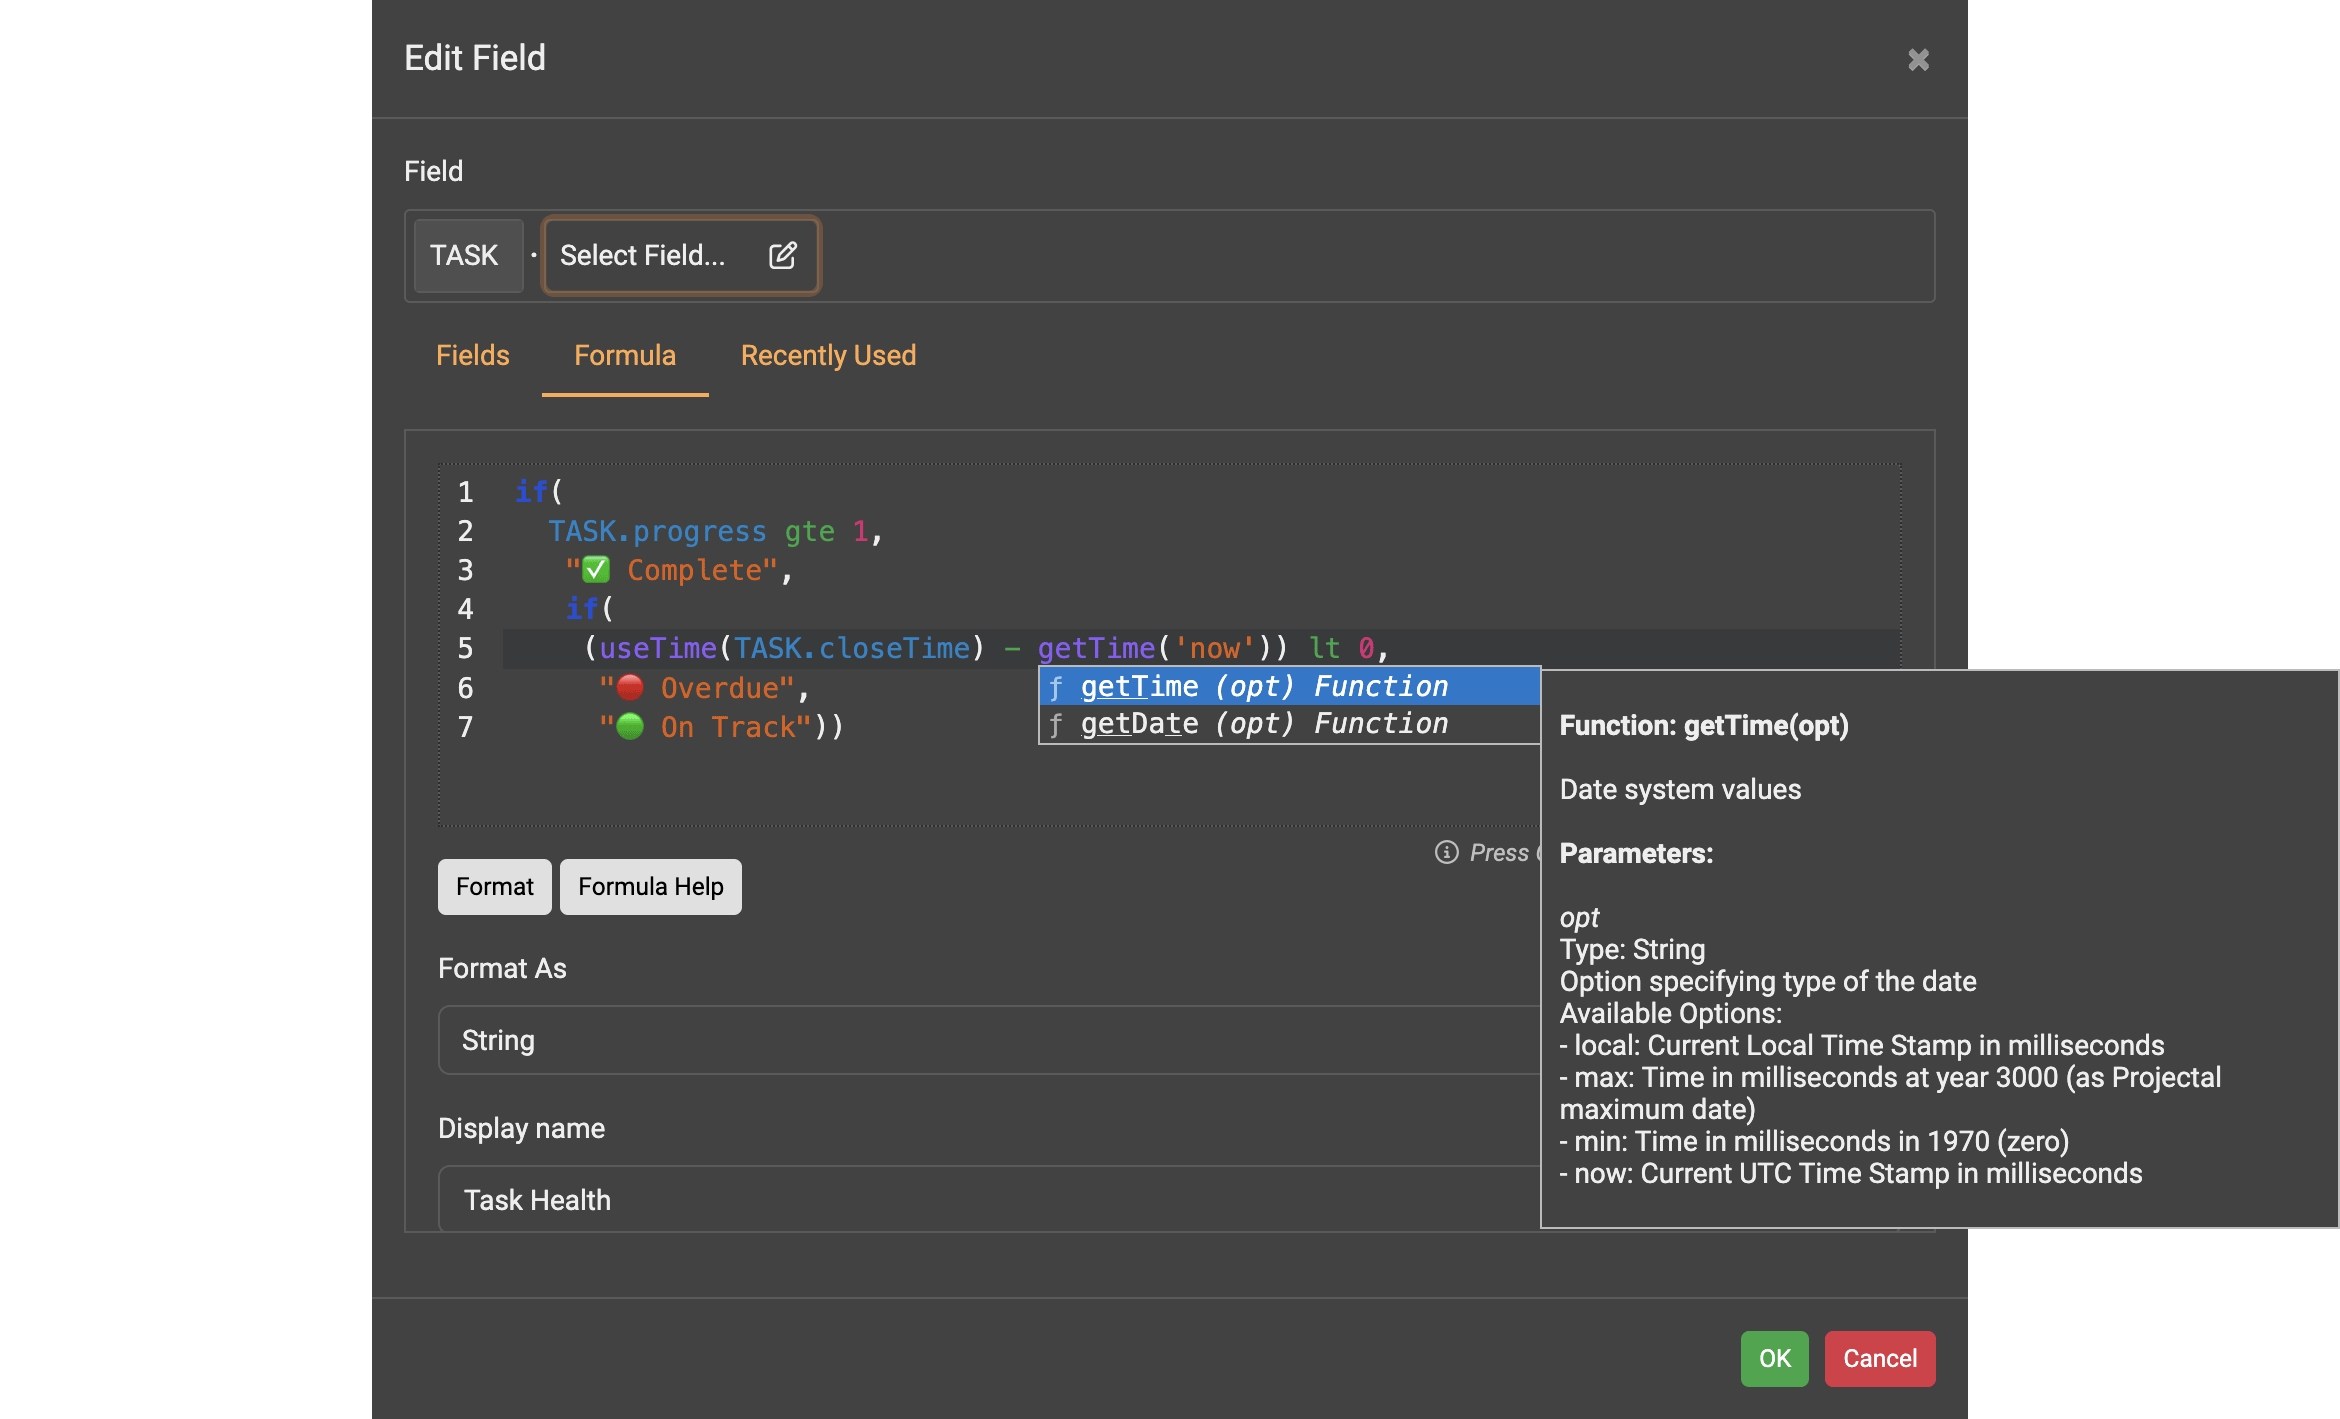
Writing a formula
A simple formula column looks like this:
round2(TASK.estimatedCost * 1.15)
This formula takes the task’s estimatedCost and multiplies it by 1.15, adding 15% to the original cost. round2() rounds the result to two decimal places. With the display format set to Decimal in Format As, an estimated cost of 1,000 produces a result of 1,150.
A few conventions are useful to know when writing formulas:
Example report: Budget variance and status
A common report in a creative business is a list of active projects showing the variance between budget and actual cost, along with a simple status indicator. A Projectal Data View can provide this information with live updates as budgets and actual costs change:
To build this report, first add plain columns for PROJECT.name, PROJECT.fixedCost and PROJECT.actualCost. Then, we need to calculate the budget variance with a formula column.
Budget variance formula
How it works:
This formula first checks whether the project has a budget assigned to the fixed cost field. If PROJECT.fixedCost is zero, it returns "No budget set" rather than attempting to divide by zero.
It then checks if any actual cost has been logged. If PROJECT.actualCost is zero, it returns "No cost logged" instead of a percentage, since a project with a budget but no spend (indicating that the project has not started) would always show a flat -100%.
If both a budget and actual cost exist, it subtracts the budget from the actual cost, divides the difference by the budget, and multiplies the result by 100 to produce the percentage variance. round() rounds the result to a whole number, and a "%" symbol is appended so the value displays as a percentage (e.g. -28%).
A positive percentage means the actual cost is higher than the budget. A negative percentage means the actual cost is below the budget.
Status formula
Finally, a second formula column can turn the variance into a simple status indicator:
How it works:
This formula first checks whether the project has a budget. If PROJECT.fixedCost is zero, it returns a white ⚪ indicator rather than treating an unbudgeted project as either over or under budget.
If a budget exists, it compares the project’s actual cost with the budget. If actual cost exceeds the budget, it returns a red 🔴 indicator. Otherwise, it checks whether actual cost exceeds 85% of the budget. If so, it returns a yellow 🟡 indicator. If neither condition is met, it returns a green 🟢 indicator.
Note: The indicator dots are emoji/Unicode characters. You can use these or other Unicode characters in your reports by including them as text values in your formulas.
Set Format As Decimal for the variance column and Format As String for the status column. Both values update automatically as the project’s costs change.
Getting more help
If you need more information about using formulas or Data Views, see the Projectal Helpdesk articles for detailed explanations, examples, and reference information. These articles cover the available formula functions, operators, and syntax, along with additional guidance for creating and using formulas in Data Views.
New to Projectal? Experience how to get real-time insights and analytics about your creative business. Start a free, fully-featured 30-day trial, or contact us to schedule a personalized demo and see dynamic reporting with custom formulas in action.