Slice and Dice Your Studio Data with Projectal
Projectal features an intuitive visual query builder allowing you to drill into project data and create Data Views for your specific role within the studio.
In this example, we have logged into Projectal as Holly Lauder, Head of Layout for the studio Ninety Pixels. To support her role, Holly would like to display current layout tasks across all active projects at the studio.
Before Projectal, Holly would have to manually create Excel spreadsheets linking the various worksheets for each project, or wait for the IT department to create reports based on her requirements. Any changes or new projects would require everything to be created again.
With Projectal, Holly can now easily create a live Data View for her department showing the task, crew, scheduling and resource needs of active projects, in real-time.
Visual Query Builder
Using Projectal's point-and-click query builder, Holly would ask to:
Show me all the Tasks:

With the skill Layout:

That are less than 100% complete:

Real-Time Data Views
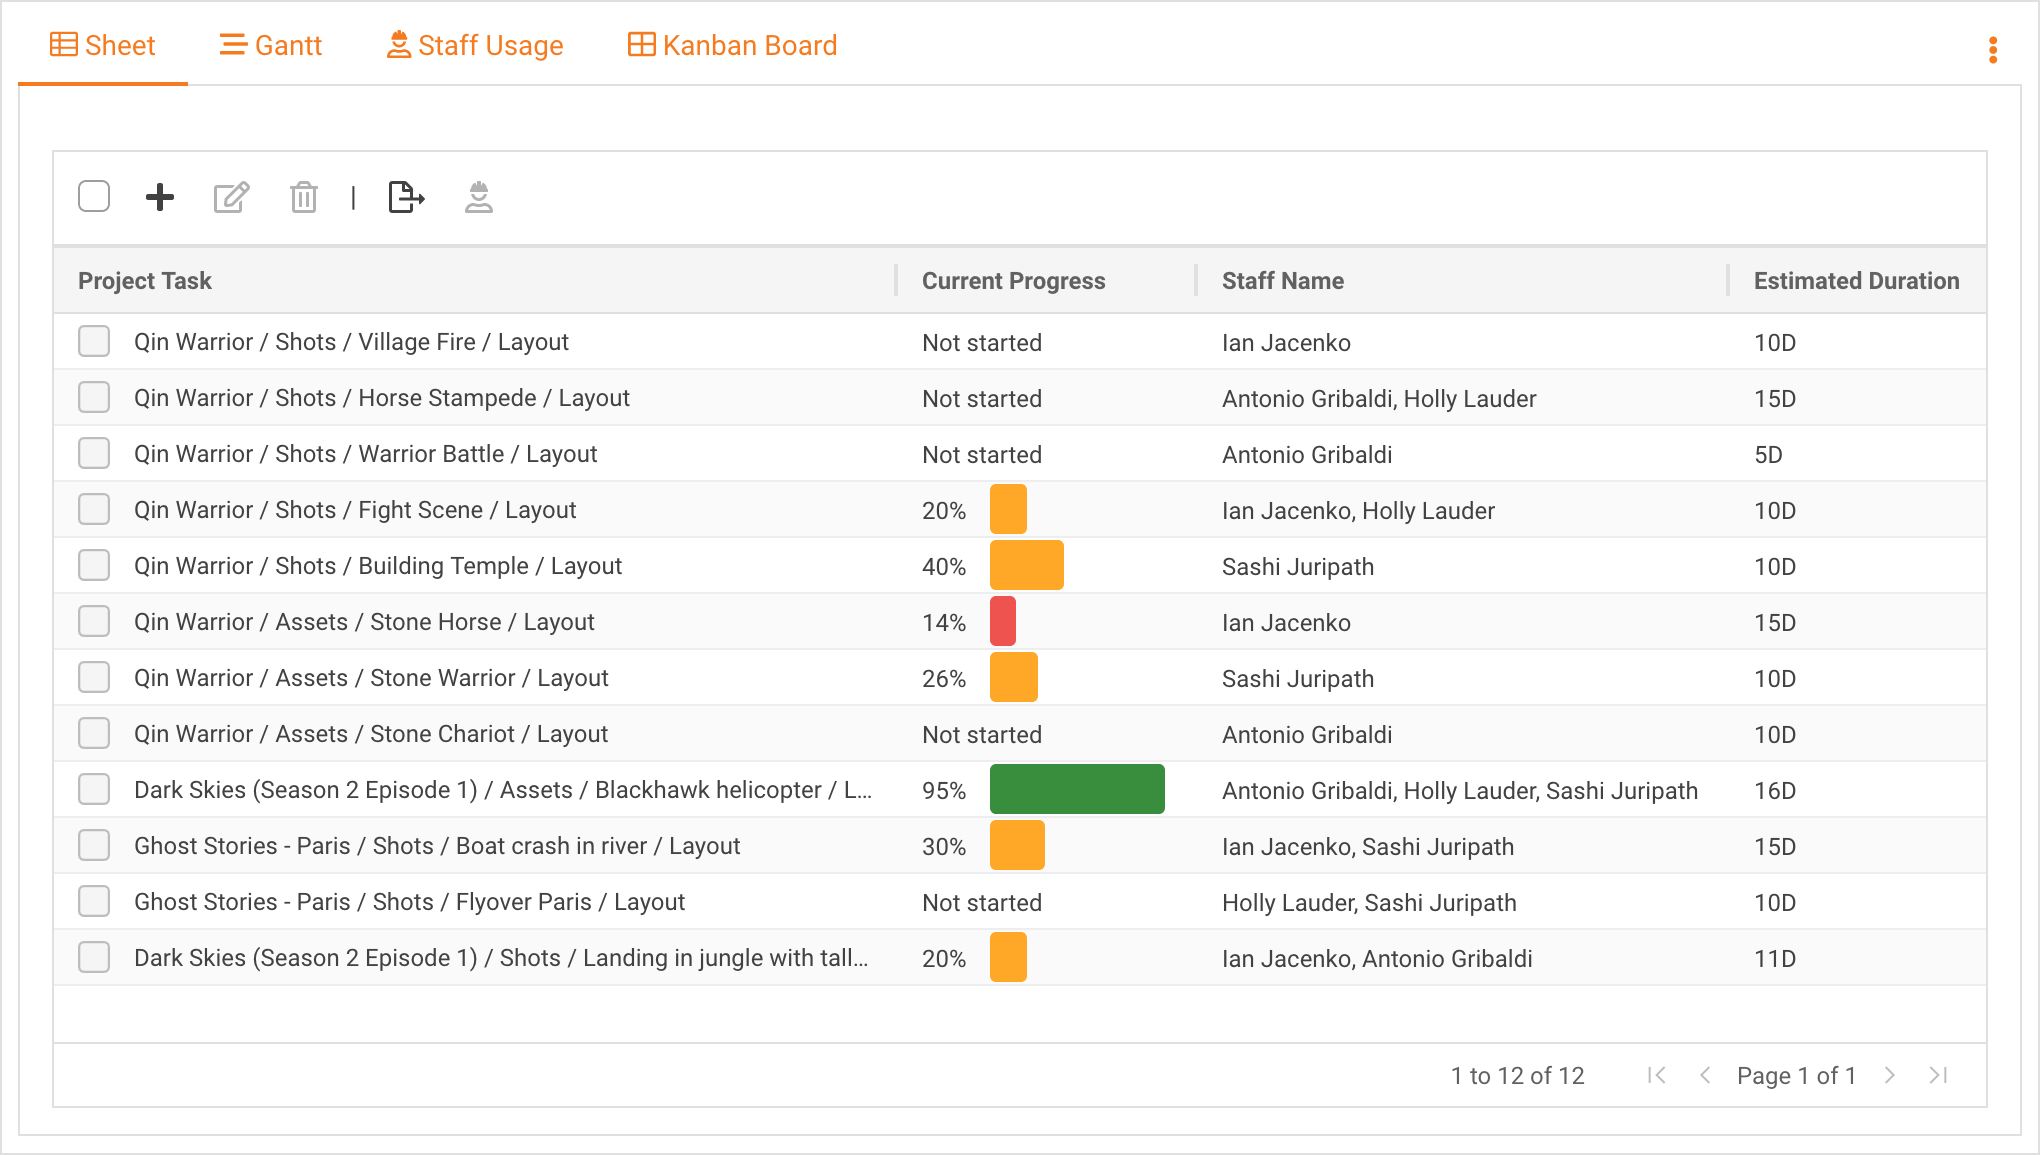
After filtering the studio data with the above query, Holly would then choose the entities to display. In this case, she selected the project task name, current progress, assigned staff names and estimated duration:
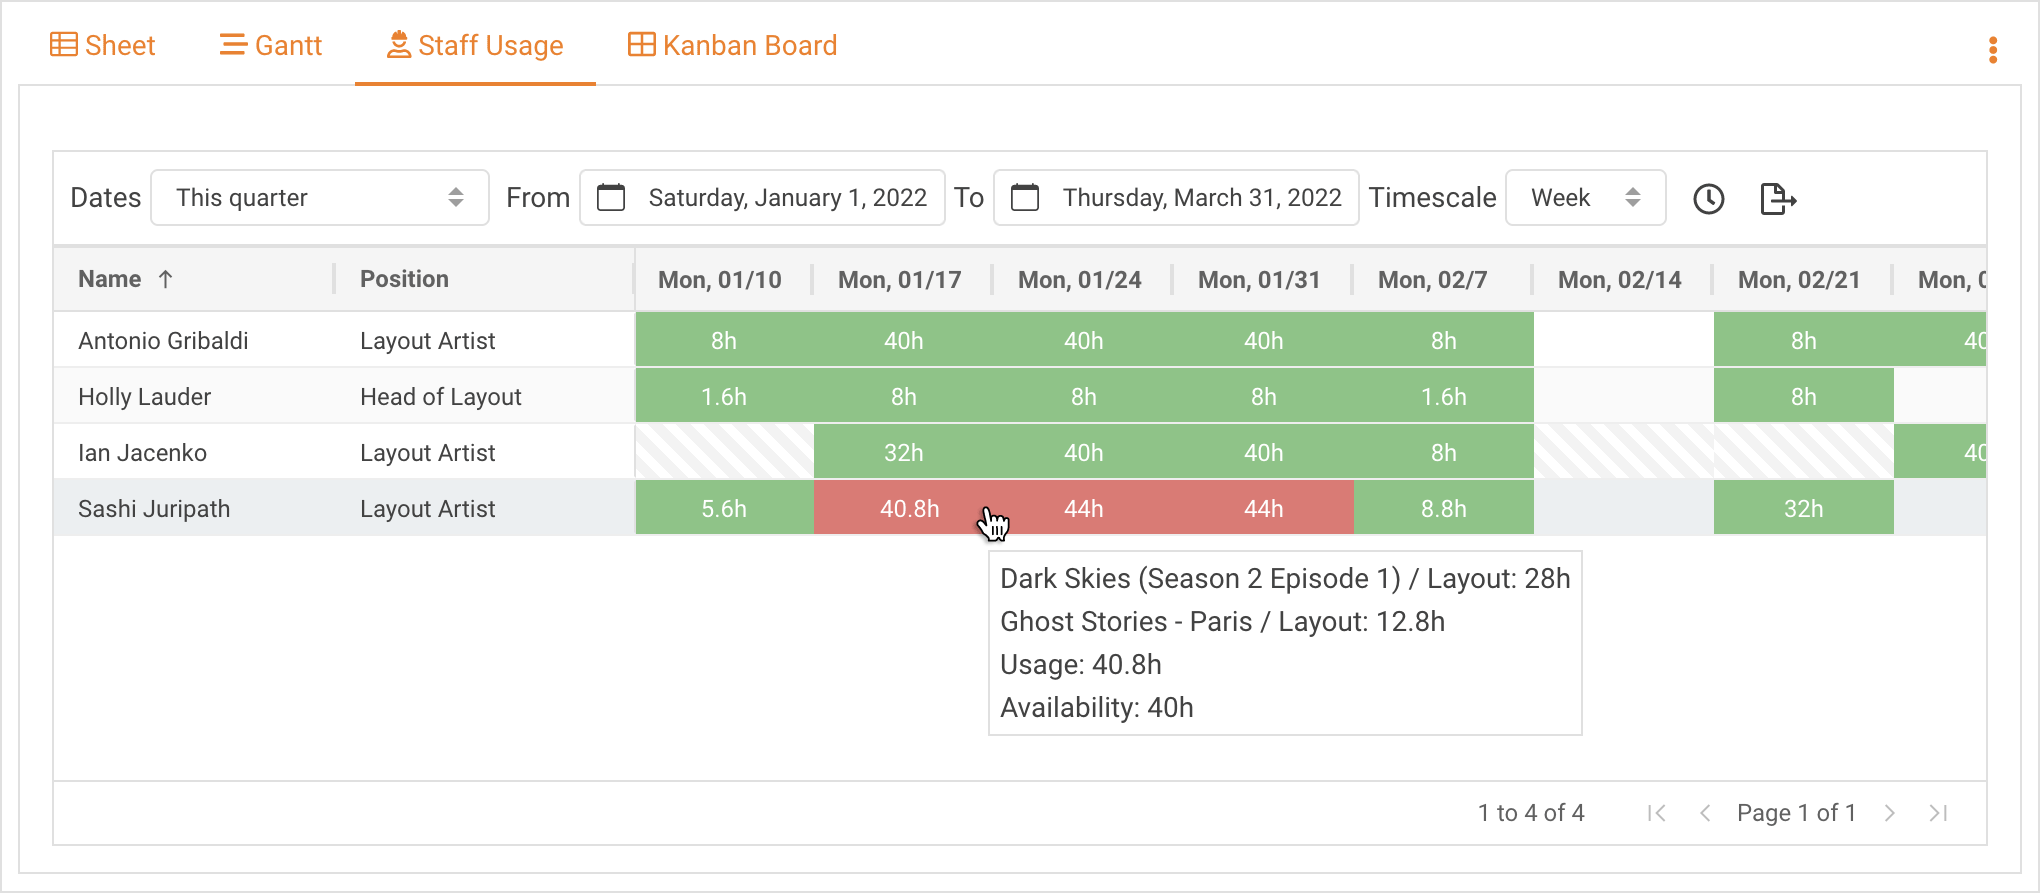
Based on the queried data, Projectal will also automatically display other views of relevant information, for example a gantt chart, kanban board or as shown below, a staff usage view with over-allocation:
To learn more about the other types of Data Views that can be created, along with Projectal's dynamic charting capabilities, visit https://projectal.com/features/reporting.