Get business insights with powerful analytics and reports.
Build live reports and calculate the metrics your business needs. Use completed projects to improve future work.



Reporting that fits the way your team works.
Use live and historical data, add custom calculations and control who can see the results.

Build custom reports
Filter, group and display project, task, staff and financial information.

Calculate useful metrics
Create computed fields with formulas, operators and conditionals.

Create clear dashboards
Turn reporting views into clear visuals for teams and management.

Review past projects
Compare estimates with actual outcomes and retain proven approaches.
Turn live project data into reports people can act on.
Build focused views for detailed task follow-up or a concise portfolio summary, with the measures and health signals each audience needs.
Data View example: Task delivery health
Review progress, schedule risk and estimate performance across active work.
| Task | Project | Assigned To | Progress | Delivery Health | Progress Indicator | Estimate Health | Start | Due | Estimated Duration | Actual Duration |
|---|---|---|---|---|---|---|---|---|---|---|
| Lighting | Neon Divide | Dmitry Zonez |
87%
|
⛔ Overdue | ◕ Nearly Done | ≈ Near Estimate | 2026-09-09 | 2026-09-29 | 15D | 13D |
| Environment | Neon Divide | Noah Sinclair |
92%
|
⛔ Overdue | ◕ Nearly Done | ≈ Near Estimate | 2026-08-25 | 2026-09-29 | 25D | 25D |
| Integration | Aetheria | Jacob Baker |
41%
|
⚠️ Due Soon | ◐ In Progress | ▼ Within Estimate | 2026-09-24 | 2026-09-30 | 5D | 2D |
| Lighting | Digital Fugitive | Yuri Rylenko |
91%
|
⚠️ Due Soon | ◕ Nearly Done | ≈ Near Estimate | 2026-08-19 | 2026-09-30 | 30D | 29D |
| Testing & Debugging | Aetheria | Ryan Phillips |
35%
|
🟢 On Track | ◐ In Progress | ▼ Within Estimate | 2026-09-22 | 2026-10-05 | 10D | 4D |
| Effects | Spark & Fizz | Ralph Medicio | Not started | 🟢 On Track | ○ Not Started | ▼ Within Estimate | 2026-09-28 | 2026-10-05 | 5D | 0D |
| Compositing | The Vanished | Compositor |
82%
|
🟢 On Track | ◕ Nearly Done | ▲ Over Estimate | 2026-08-19 | 2026-10-05 | 33D | 34D |
| Modeling | The Vanished | Modeler |
57%
|
🟢 On Track | ◕ Nearly Done | ▼ Within Estimate | 2026-09-15 | 2026-10-05 | 15D | 9D |
| Roto | The Vanished | Roto Artist |
25%
|
🟢 On Track | ◐ In Progress | ▼ Within Estimate | 2026-09-23 | 2026-10-07 | 11D | 3D |
| Concept | Spark & Fizz | Vishina Gunam | Not started | 🟢 On Track | ○ Not Started | ▼ Within Estimate | 2026-09-28 | 2026-10-08 | 8D | 0D |
| Animation | Aetheria | Destiny Johnson |
12%
|
🟢 On Track | ◐ In Progress | ▼ Within Estimate | 2026-09-24 | 2026-10-15 | 15D | 2D |
| Effects | The Vanished | Effects Artist |
43%
|
🟢 On Track | ◐ In Progress | ▼ Within Estimate | 2026-09-09 | 2026-10-20 | 30D | 13D |
Data View example: Staff capacity and delivery risk
See weekly workload, capacity and delivery risk at a glance.
| Staff member | Role | Capacity status | Load meter | Weekly load | Assigned hours | Capacity hours | Weekly tasks |
|---|---|---|---|---|---|---|---|
| Michael Tan | Marketing Technologist | 🟢 On track | 🟩🟩🟩 | 80% | 32 | 40 | 1 |
| Eddie Atamoko | Compositing Artist | 🟠 Busy | 🟧🟧🟧 | 100% | 40 | 40 | 1 |
| Andrew Kaplan | Data Analyst | 🔵 Available | 🟦⬜⬜ | 20% | 8 | 40 | 1 |
| Antonio Gribaldi | Layout Artist | 🔴 Overloaded | 🔥🔥🔥 | 120% | 48 | 40 | 1 |
| Chase Turner | Project Manager | 🔵 Available | 🟦⬜⬜ | 4% | 1.6 | 40 | 3 |
| Chloe Park | Digital Designer | 🔴 Overloaded | 🔥🔥🔥 | 120% | 48 | 40 | 2 |
| Dmitry Zonez | Lighting Artist | 🔵 Available | 🟦⬜⬜ | 20% | 8 | 40 | 1 |
| Emily Chen | Creative Director Digital | 🔵 Available | 🟦⬜⬜ | 40% | 16 | 40 | 2 |
| Marcus Hunter | Compositing Artist | 🔴 Overloaded | 🔥🔥🔥 | 120% | 48 | 40 | 2 |
| Michaela Carter | Lead Engineer | 🔴 Overloaded | 🔥🔥🔥 | 240% | 96 | 40 | 1 |
| Omar El-Sayed | Renderer | 🟠 Busy | 🟧🟧🟧 | 100% | 40 | 40 | 1 |
| Priya Desai | Director Analytics | 🟢 On track | 🟩🟩🟩 | 80% | 32 | 40 | 1 |
| Ryan Phillips | Senior QA Tester | 🔴 Overloaded | 🔥🔥🔥 | 240% | 96 | 40 | 2 |
| Sarah Collins | Head of Production | 🔵 Available | 🟦⬜⬜ | 4% | 1.6 | 40 | 3 |
Spreadsheet-style reports using live Projectal data.
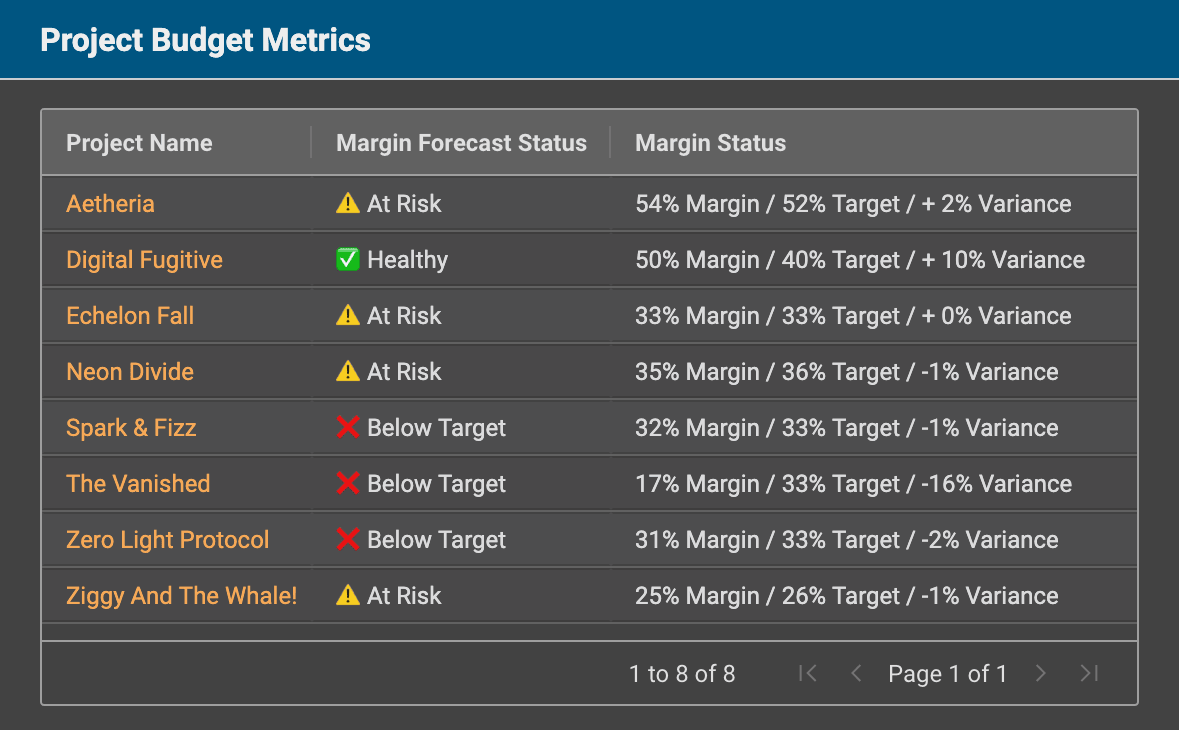
Create advanced calculations inside a Data View without exporting a stale copy of the report to a spreadsheet.
Use formulas to combine fields, test conditions and calculate the measures your team relies on. The results update whenever the underlying Projectal data changes, so the report stays current as projects progress.
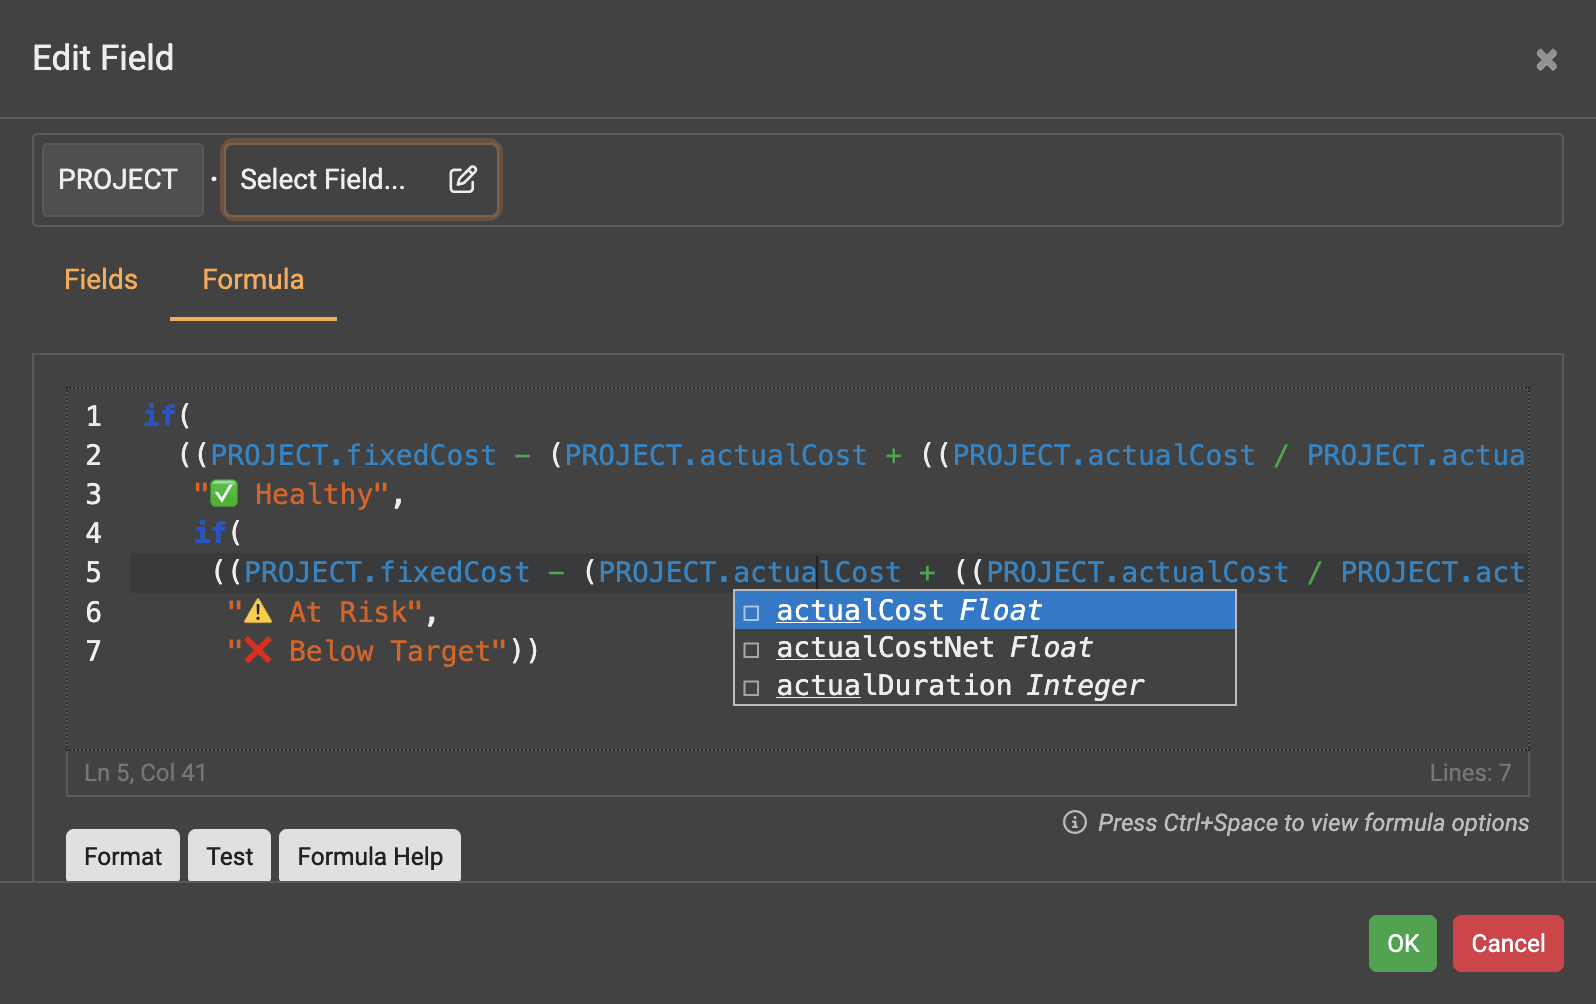
- Calculate budget, cost, schedule and utilization variances
- Use conditional logic to create RAG status and exception flags
- Build reusable metrics from more than 80 functions and operators
- Keep every calculated result synchronized with live Projectal data
See the data you need.
Build interactive reports without writing database queries.
Filter and group project, staff, task, department, resource and financial data with the visual query builder. Add any calculations you need.
- Keep reports public, private or restricted
- Export results for use in other tools
- Turn report data into charts and dashboard visuals
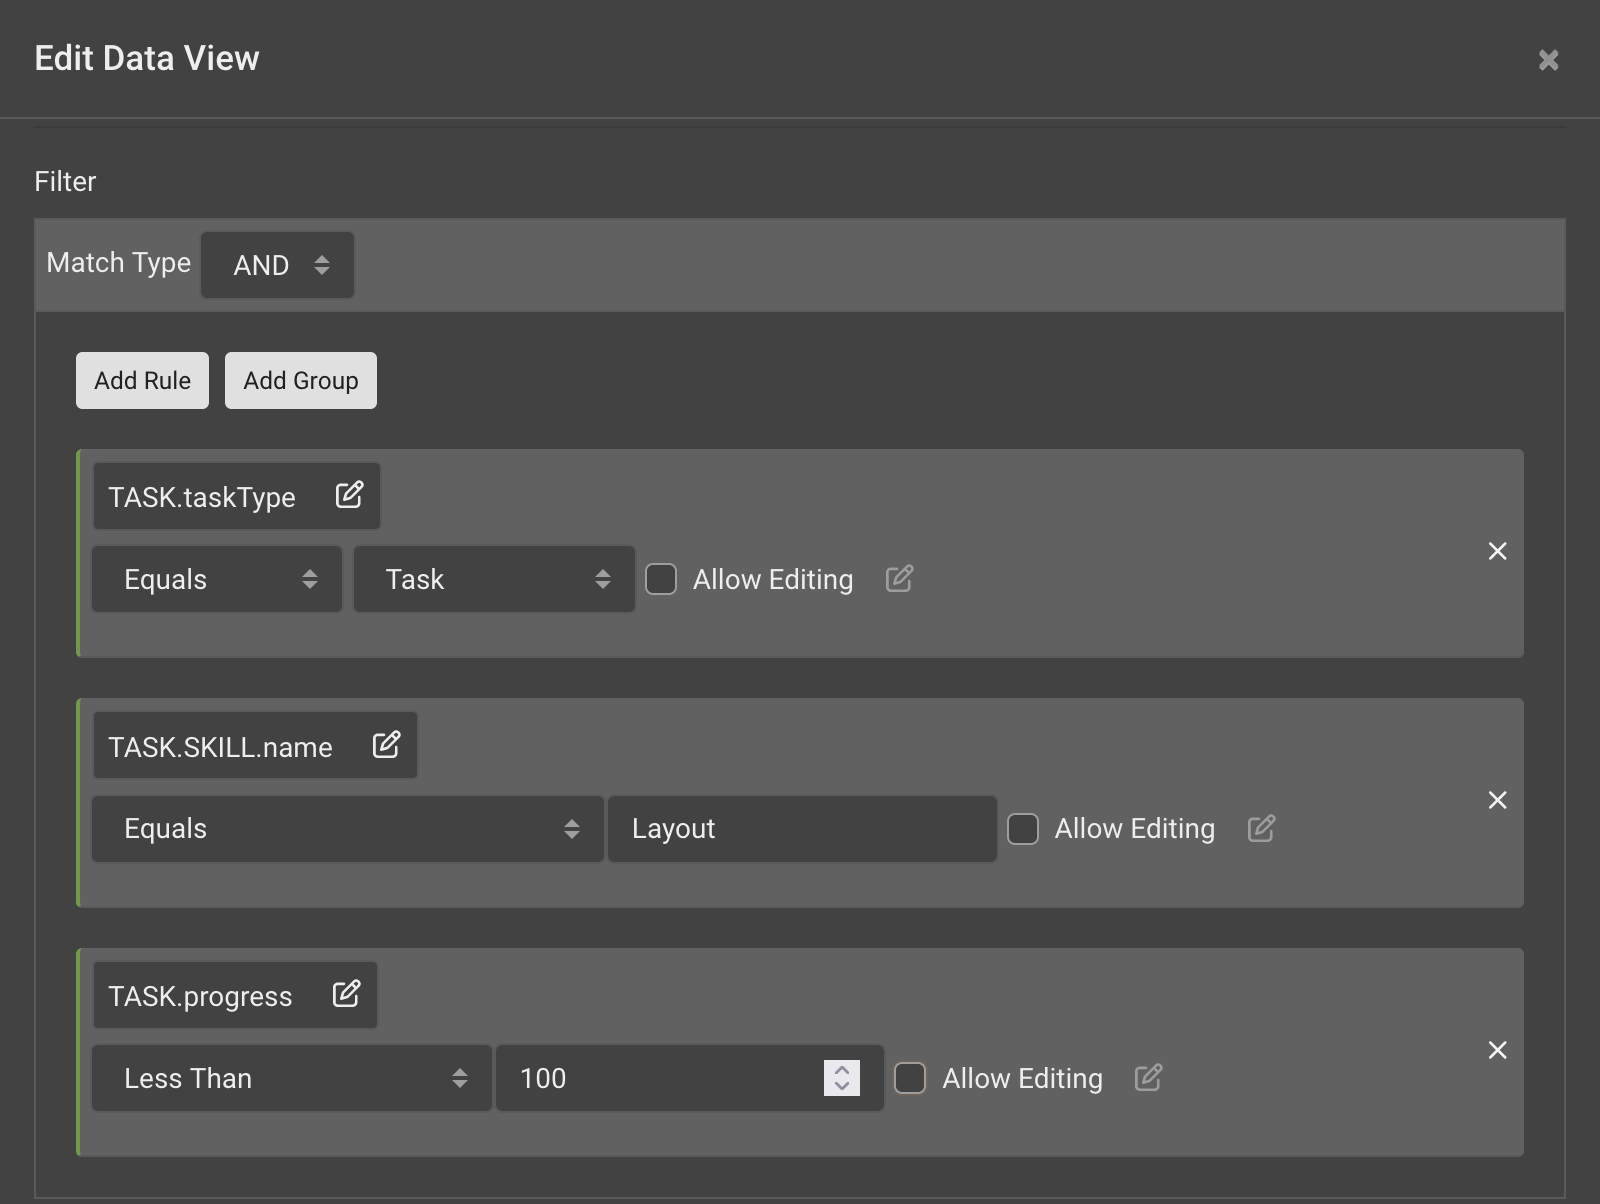
Build Data Views with the visual query builder.

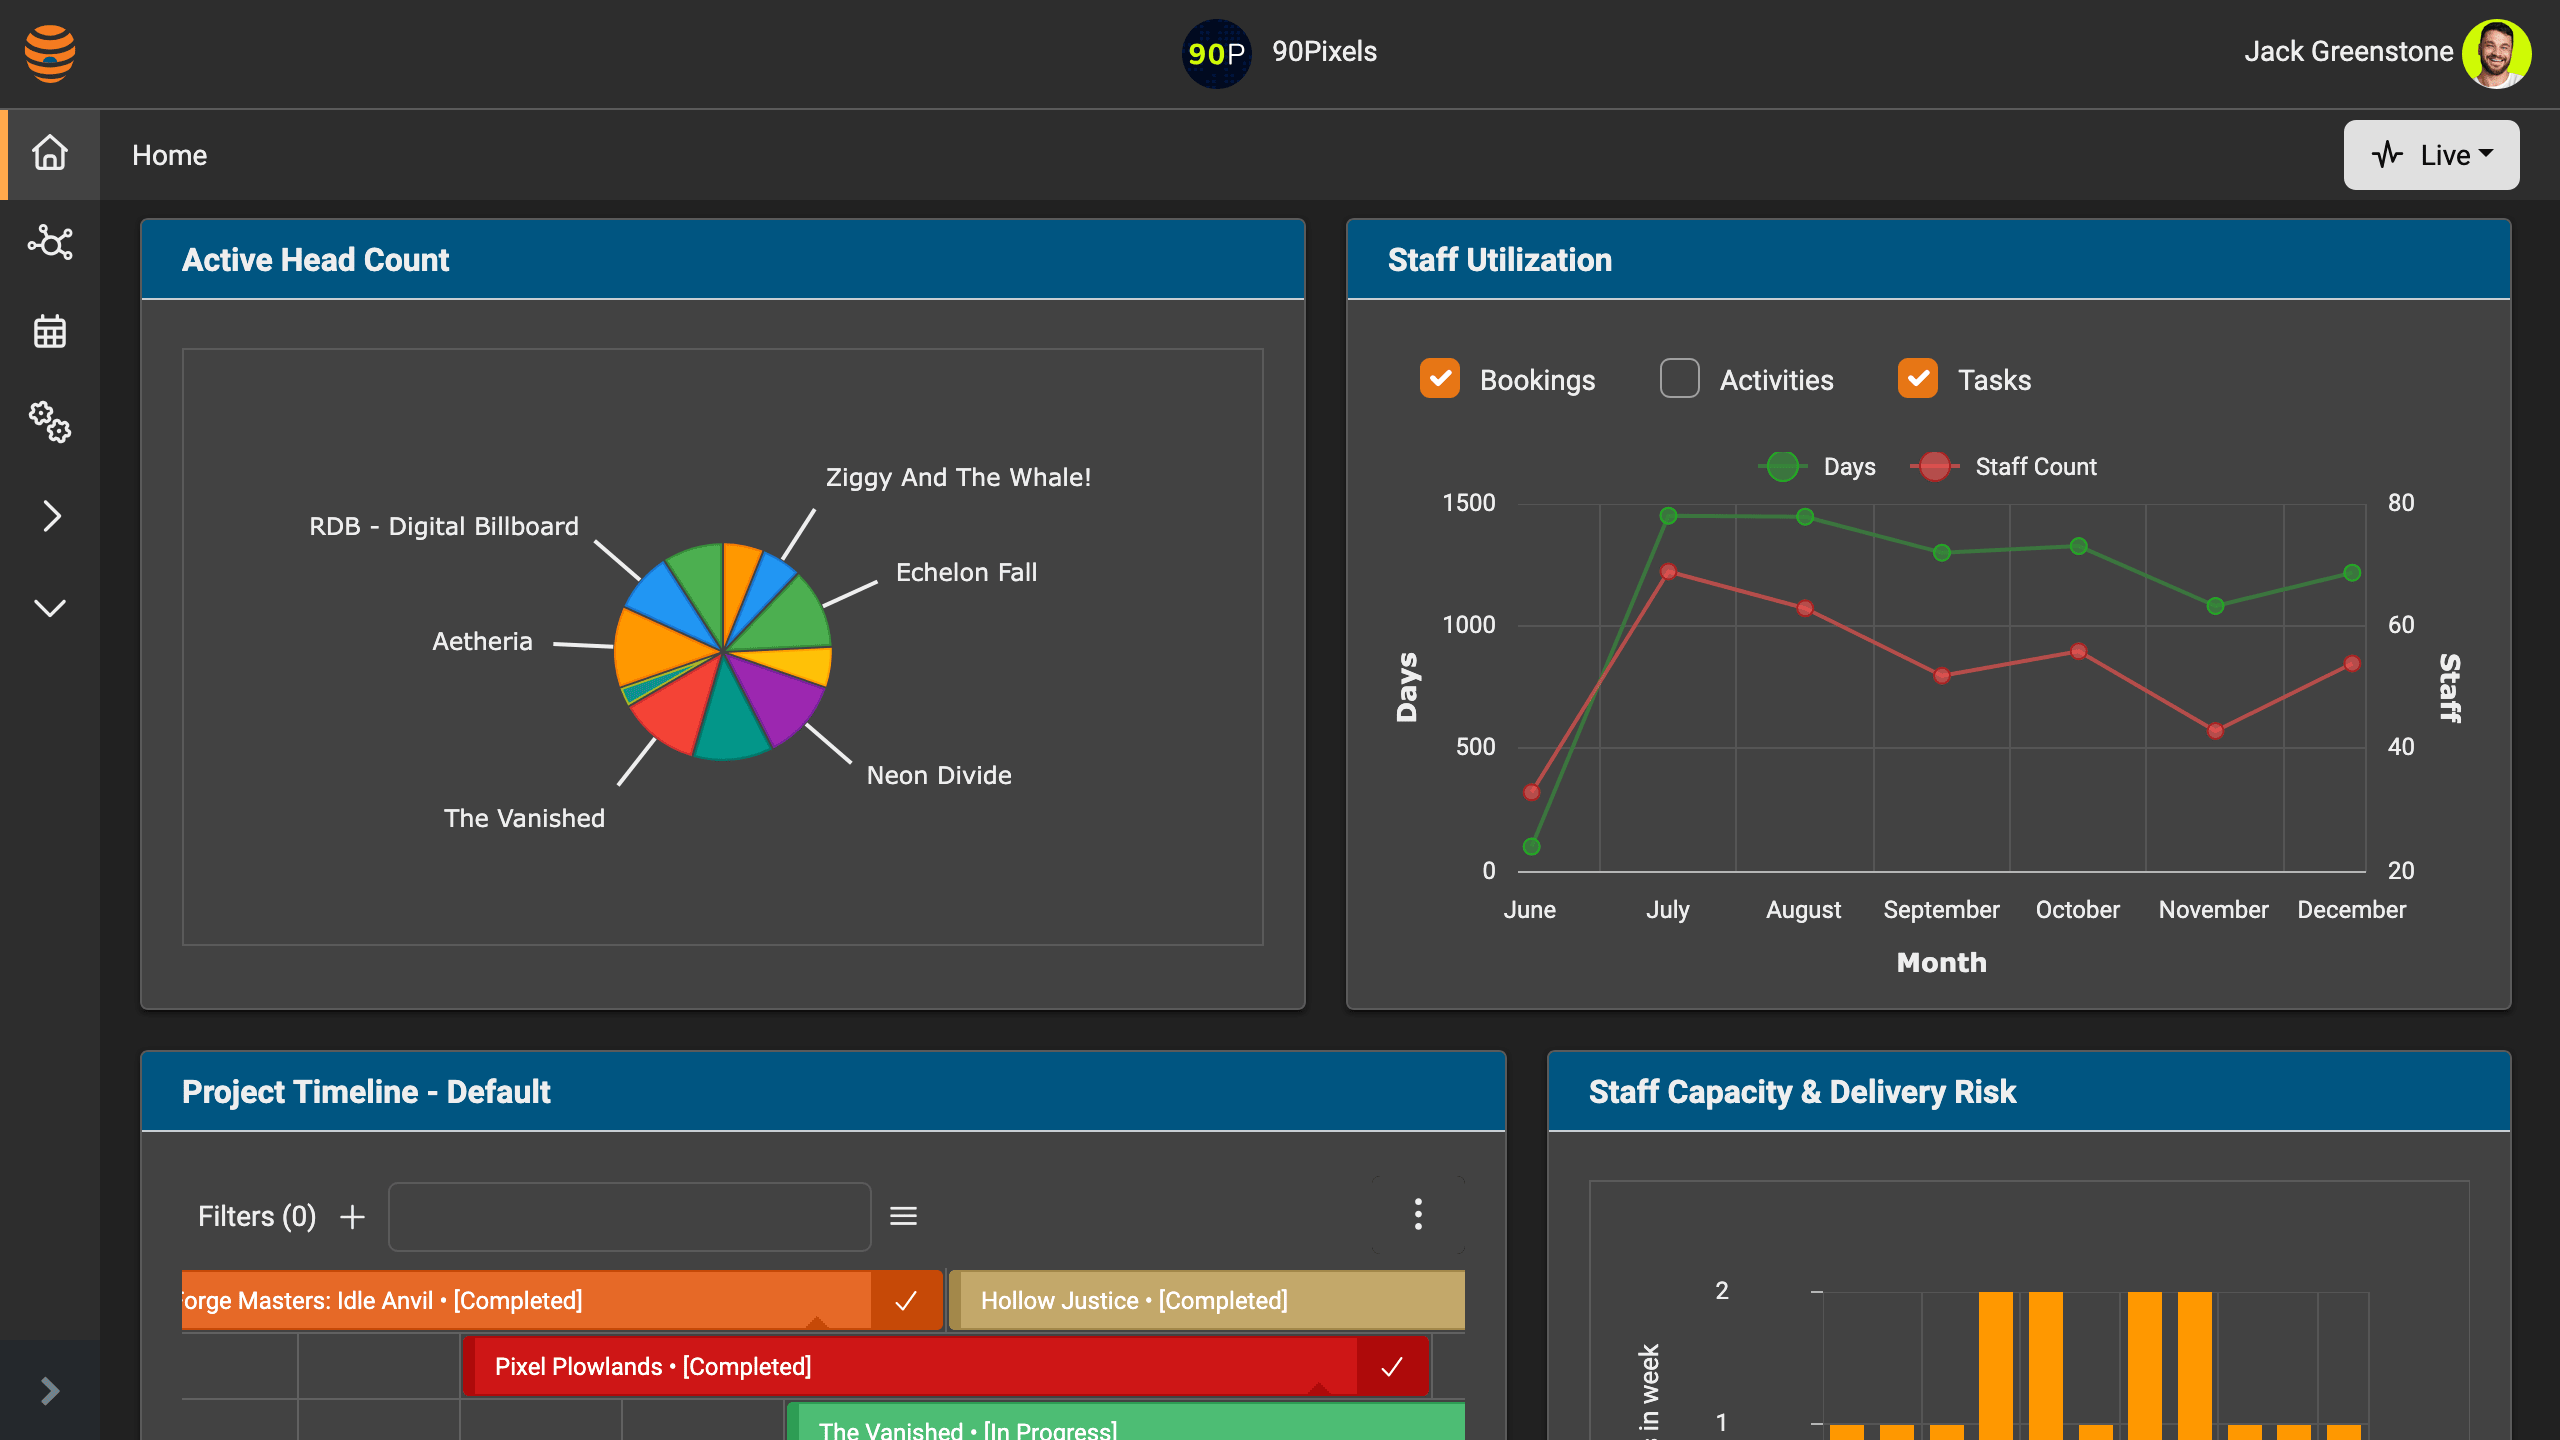
Use charts and historical project data to reveal performance patterns.
Make project information easier to understand.
Turn live and historical data into charts that highlight progress, patterns and risk.
Compare estimates with actual results, spot trends across projects and share clear visual summaries with teams and management.
Keep reporting clear and consistent.
Give project teams and management reliable information drawn from the same Projectal records.
Live project data
Base every report on the latest project information.
Consistent calculations
Use the same formulas and definitions across teams.
Reports for each audience
Show each group the level of detail it needs.
Project history
Follow changes and outcomes from bid to delivery.
See Projectal turn live data into useful reports.
Combine Data Views, formulas, charts and project history to answer the questions your business asks.

